

The popularity of live support is rapidly increasing, and it can be an effective way to quickly resolve customer problems. The customer satisfaction rate for this channel is higher than most other platforms. But you have to use it in the right way. There are a number of metrics you can use to help optimize your service.
Here are the most popular ones and what they mean for your business.
Number of Support Interactions
The total number of conversations your company has is a good metric to gauge how well you are providing support for your customer’s needs. It can help you to decide if you have enough staff in this department. And if you are getting large amounts of correspondence from particular issues, then you may need to invest some time resolving them.
Customer Satisfaction Score
This is the score collected from customer surveys, usually at the end of an interaction. This is great place to look at how to improve customer service. If it is low, you need to look at why this is? It may be your response time is too slow or your staff need more training.
Smart Tip:
With Xeno, you can add surveys that will be displayed at the end of any conversation. That way, you can obtain a Net Promoter Score (NPS) thanks to a star rating question, or even recommendations through a close- or open-ended question.
First Response Time
This is the time taken from a customer making contact for the first time with your business to getting a reply. This is one of the first places you should look if you want to know how to improve customer service. High customer service speed is one of the most important factors for customer satisfaction in live support interactions. In a study by Convince and Convert, 32% of people expected a live response within 30 minutes. If your response time isn’t up to scratch, you may need a staffing schedule for live support that covers busy times more effectively.
Conversations Per Staff Member
Looking at how many conversations each individual staff member has can show you who may be struggling and who is excelling. You may want to offer extra training to those team members not doing so well. Whilst you can look at why the top performers have such a high customer service speed and how you can replicate that with other members of the team.
Chat Handling Time
This is how long an issue takes to resolve from start to finish. If you can quickly resolve customer problems, then you are on the way to delighting your customers. In a report by Forrester, 77% of customers say that valuing their time is the most important thing a company can do to provide them with good customer service.
Your turn!
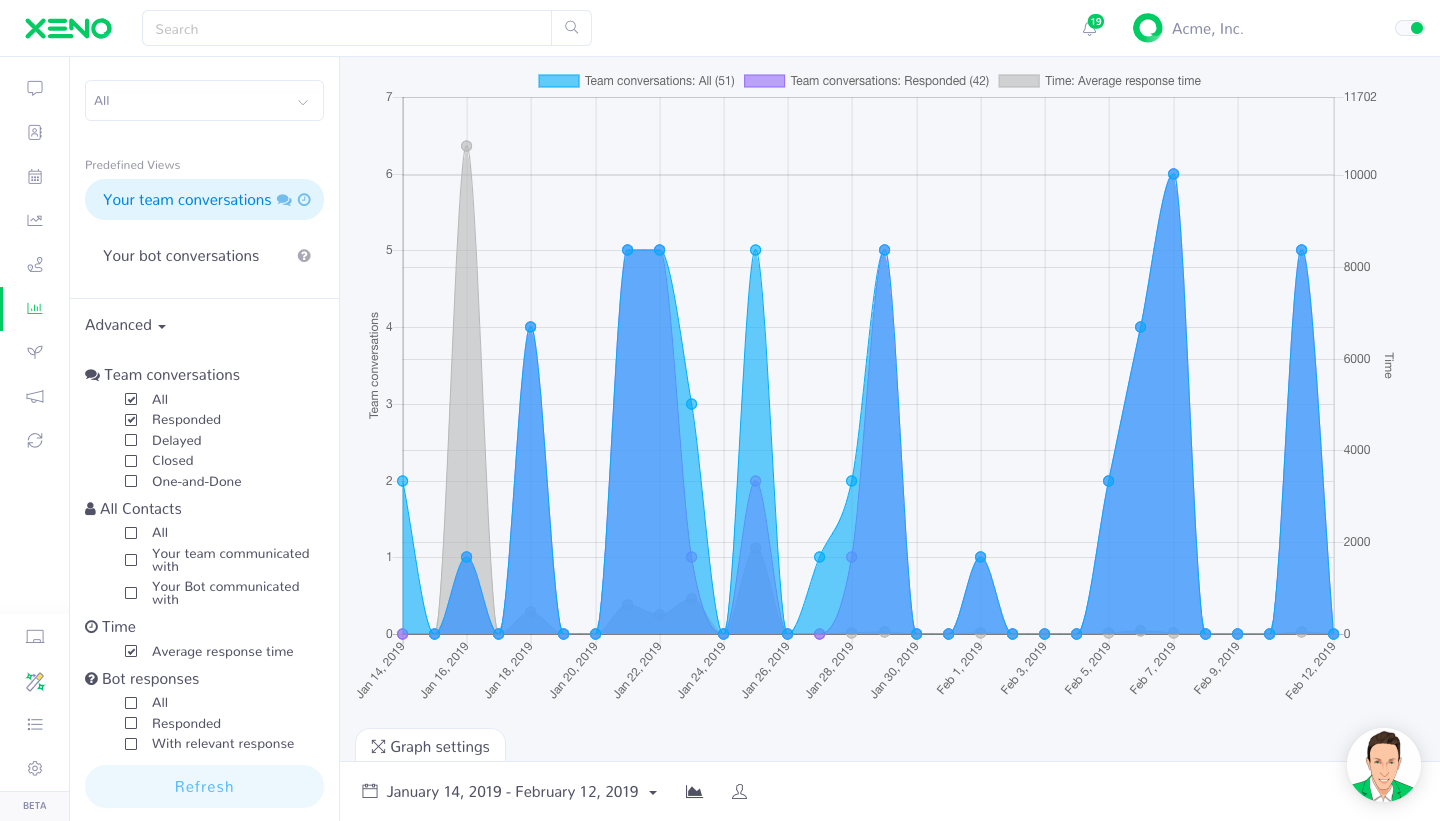
The Xeno live customer service app offers a variety of metrics.
Indeed, on the Analytics page, you can see how many unique people have communicated with your team on a rolling 7, 14, 30 or 90-day period. Delve into average response time info and even see where your communications are coming from across the world. Hopefully now you can make sense of these stats to ensure you are offering the best customer service experience.